Level: Introductory
Sandra K. Johnson (sandraja@us.ibm.com), IBM Linux Technology Center
William H. Hartner (bhartner@us.ibm.com), IBM Linux Technology Center
William C. Brantley (Bill.Brantley@amd.com), Advanced Micro Devices
January 2003
The first step in improving Linux performance is quantifying it. But how exactly do you quantify performance for Linux or for comparable systems? In this article, members of the IBM Linux Technology Center share their expertise as they describe how they ran several benchmark tests on the Linux 2.4 and 2.5 kernels late last year.
Contents
Analysis methodologyThe Linux operating system is one of the most successful open source projects to date. Linux exhibits high reliability as a Web server operating system, and it has significant market share in this market. Web servers are typically low-end to midrange systems with up to 4-way symmetric multiple processors (SMP); enterprise-level systems have more complex requirements, such as larger processor counts and I/O configurations and significant memory and bandwidth requirements. In order for Linux to be enterprise-ready and commercially viable in the SMP market, its SMP scalability, disk and network I/O performance, scheduler, and virtual memory manager must be improved relative to commercial UNIX systems.
The Linux Scalability Effort (LSE) (see Resources for a link) is an open source project that addresses these Linux kernel issues for enterprise class machines, with 8-way scalability and beyond.
The IBM Linux Technology Center's (LTC) Linux Performance Team (see Resources for a link) actively participates in the LSE effort. In addition, their objective is to make Linux better by improving Linux kernel performance with special emphasis on SMP scalability.
This article describes the strategy and methodology used by the team for measuring, analyzing, and improving the performance and scalability of the Linux kernel, focusing on platform-independent issues. A suite of benchmarks is used to accomplish this task. The benchmarks provide coverage for a diverse set of workloads, including Web serving, database, and file serving. In addition, we show the various components of the kernel (disk I/O subsystem, for example) that are stressed by each benchmark.
Here we discuss the analysis methodology we used to quantify Linux performance for SMP scalability. If you prefer, you can skip ahead to the section.
Our strategy for improving Linux performance and scalability includes running several industry accepted and component-level benchmarks, selecting the appropriate hardware and software, developing benchmark run rules, setting performance and scalability targets, and measuring, analyzing and improving performance and scalability. These processes are detailed in this section.
Performance is defined as raw throughput on a uniprocessor (UP) or SMP. We distinguish between SMP scalability (CPUs) and resource scalability (number of network connections, for example).
The architecture used for the majority of this work is IA-32 (in other words, x86), from one to eight processors. We also study the issues associated with future use of non-uniform memory access (NUMA) IA-32 and NUMA IA-64 architectures. The selection of hardware typically aligns with the selection of the benchmark and the associated workload. The selection of software aligns with IBM's Linux middleware strategy and/or open source middleware. For example:
During benchmark setup, we developed run rules to detail how the benchmark is installed, configured, and run, and how results are to be interpreted. The run rules serve several purposes:
Performance and scalability targets for a benchmark are associated with a specific SUT (hardware and software configuration). Setting performance and scalability targets requires the following:
If external published results are not available, we attempt to use internal results. We also attempt to compare to other operating systems. Given the competitive data and our baseline, we select a performance target for UP and SMP machines.
Finally, a target may be predicated on getting a change in the application. For example, if we know that the way the application does asynchronous I/O is inefficient, then we may publish the performance target assuming the I/O method will be changed.
Before any measurements are made, both the hardware and software configurations are tuned. Tuning is an iterative cycle of tuning and measuring. It involves measuring components of the system such as CPU utilization and memory usage, and possibly adjusting system hardware parameters, system resource parameters, and middleware parameters. Tuning is one of the first steps of performance analysis. Without tuning, scaling results may be misleading; that is, they may not indicate kernel limitations but rather some other issue.
The benchmark runs are made according to the run rules so that both performance and scalability can be measured in terms of the defined performance metric. When calculating SMP scalability for a given machine, we chose between computing this metric based upon the performance of a UP kernel or computing it upon the performance of an SMP kernel, with the number of processors set to 1 (1P). We decided to compute SMP scalability using UP measurements to more accurately reflect the SMP kernel performance improvements.
A baseline measurement is made using the previously determined version of the Linux kernel. For most benchmarks, both UP and SMP baseline measurements are made. For a few benchmarks, only the 8-way performance is measured since collecting UP performance information is time prohibitive. Most other benchmarks measure the amount of work completed in a specific time period, which takes no longer to measure on a UP than on an 8-way.
The first step required to analyze the performance and scalability of the SUT (System Under Test) is to understand the benchmark and the workload tested. Initial performance analysis is made against a tuned system. Sometimes analysis uncovers additional modifications to tuning parameters.
Analysis of the performance and scalability of the SUT requires a set of performance tools. Our strategy is to use Open Source community (OSC) tools whenever possible. This allows us to post analysis data to the OSC in order to illustrate performance and scalability bottlenecks. It also allows those in the OSC to replicate our results with the tool or to understand the results after experimenting with the tool on another application. If ad hoc performance tools are developed to gain a better understanding of a specific performance bottleneck, then the ad hoc performance tool is generally shared with the OSC. Ad hoc performance tools are usually simple tools that instrument a specific component of the Linux kernel. The performance tools we used include:
Ad hoc performance tools are developed to further understand a specific aspect of the system.
Examples are:
Performance analysis data is then used to identify performance and scalability bottlenecks. A broad understanding of the SUT and a more specific understanding of certain Linux kernel components that are being stressed by the benchmark are required, in order to understand where the performance bottlenecks exist. There must also be an understanding of the Linux kernel source code that is the cause of the bottleneck. In addition, we work very closely with the LTC Linux kernel development teams and the OSC (Open Source community) so that a patch can be developed to fix the bottleneck.
An evaluation of the Linux kernel performance may require several cycles of running the benchmarks, conducting an analysis of the results to identify performance and scalability bottlenecks, addressing any bottlenecks by integrating patches into the Linux kernel and running the benchmark again. The patches can be obtained by finding existing patches in the OSC or by developing new patches, as a performance team member, in close collaboration with the members of the Linux kernel development team or OSC). There is a set of criteria for determining when Linux is "good enough" and we end this process.
First, if we have met our targets and we do not have any outstanding Linux kernel issues to address for the specific benchmark that would significantly improve its performance, we assert that Linux is "good enough" and move on to other issues. Second, if we go through several cycles of performance analysis and still have outstanding bottlenecks, then we consider the tradeoffs between the development costs of continuing the process and the benefits of any additional performance gains. If the development costs are too high, relative to any potential performance improvements, we discontinue our analysis and articulate the rationale appropriately.
In both cases, we then review all of the additional outstanding Linux kernel-related issues we want to address, make an assessment of appropriate benchmarks that may be used to address these kernel component issues, examine any data we may have on the issue, and make a decision to conduct an analysis of the kernel component (or collection of components) based upon this collective information.
This section includes a description of the bottlenecks used and associated kernel components stressed by the benchmarks used in our suite. In addition, performance results and analysis is included for some of the benchmarks used by the Linux performance team.
Table 1. Linux kernel performance benchmarks| Linux kernel component | Database query | VolanoMark | SPECweb99 Apache2 |
NetBench |
Netperf | LMBench | TioBench IOZone |
| Scheduler | X | X | X | ||||
| Disk I/O | X | X | |||||
| Block I/O | X | ||||||
| Raw, Direct & Async I/O | X | ||||||
| Filesystem (ext2 & journaling) | X | X | X | X | |||
| TCP/IP | X | X | X | X | X | ||
| Ethernet driver | X | X | X | X | |||
| Signals | X | X | |||||
| Pipes | X | ||||||
| Sendfile | X | X | |||||
| pThreads | X | X | X | ||||
| Virtual memory | X | X | X | ||||
| SMP scalability | X | X | X | X | X | X |
The benchmarks used are selected based on a number of criteria: industry benchmarks that are reliable indicators of a complex workload, and component-level benchmarks that indicate specific kernel performance problems. Industry benchmarks are generally accepted by the industry to measure performance and scalability of a specific workload. These benchmarks often require a complex or expensive setup that is not available to most of the OSC (Open Source community). These complex setups are one of our contributions to the OSC. Examples include:
Component-level benchmarks measure performance and scalability of specific Linux kernel components that are deemed critical to a wide spectrum of workloads. Examples include:
Some benchmarks are commonly used by the OSC. They are preferred because the OSC already accepts the importance of the benchmark. Thus, it is easier to convince the OSC of performance and scalability bottlenecks illuminated by the benchmark. In addition, there are generally no licensing issues that prevent us from publishing raw data. The OSC can run these benchmarks because they are often simple to set up, and the hardware required is minimal. On the other hand, they often do not meet our requirements for enterprise systems. Examples include:
There are many benchmark options available for our targeted workloads. We chose the ones listed above because they are best suited for our mission, given our resources. There are some important benchmarks we chose not to utilize. In addition, we have chosen not to run some benchmarks that are already under study by other performance teams within IBM (for example, the IBM Solution Technologies System Performance Team has found that SPECjbb on Linux is "good enough"). Presented in Table 1 are the benchmarks currently used by the Linux performance team and the targeted kernel component.
Presented are descriptions of three selected benchmarks used in our suite to quantify Linux kernel performance: database query, VolanoMark, and SPECweb99. For all three benchmarks, we used 8-way machines, as detailed in the figures presenting the benchmark results.
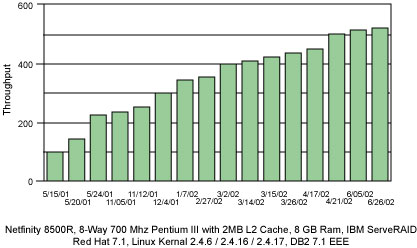
Figure 1. Database query benchmark results
Figure 1 shows the database query benchmark results. Also included is a description of the hardware and software configurations used. The figure graphically illustrates the progress we have made in achieving our target. Some of the issues we have addressed have resulted in improvements that include adding bounce buffer avoidance, ips, io_request_lock, readv, kiobuf and O(1) scheduler kernel patches, as well as several DB2 optimizations.
The VolanoMark benchmark (see Resources) creates 10 chat rooms of 20 clients. Each room echoes the messages from one client to the other 19 clients in the room. This benchmark, not yet an open source benchmark, consists of the VolanoChat server and a second program that simulates the clients in the chat room. It is used to measure the raw server performance and network scalability performance. VolanoMark can be run in two modes: loopback and network. The loopback mode tests the raw server performance, and the network mode tests the network scalability performance. VolanoMark uses two parameters to control the size and number of chat rooms.
The VolanoMark benchmark creates client connections in groups of 20 and measures how long it takes for the server to take turns broadcasting all of the clients' messages to the group. At the end of the loopback test, it reports a score as the average number of messages transferred per second. In the network mode, the metric is the number of connections between the clients and the server. The Linux kernel components stressed with this benchmark include the scheduler, signals, and TCP/IP.
Figure 2. VolanoMark benchmark results; loopback mode
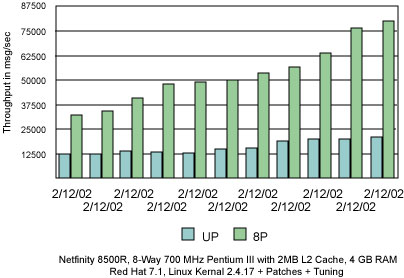
Presented in Figure 2 are the VolanoMark benchmark results for loopback mode. Also included is a description of the hardware and software configurations used and our target for this benchmark. We have established close collaboration with the members of the Linux kernel development team on moving forward to achieve this target. Some of the issues we have addressed that have resulted in improvements include adding O(1) scheduler, SMP scalable timer, tunable priority preemption and soft affinity kernel patches. As illustrated, we have exceeded our target for this benchmark; however, there are some outstanding Linux kernel component-related and Java-related issues we are addressing that we believe will further improve the performance of this benchmark.
Please note that the SPECweb99 benchmark work was conducted for research purposes only and was non-compliant, with the following deviations from the rules:
This benchmark presents a demanding workload to a Web server. This workload requests 70% static pages and 30% simple dynamic pages. Sizes of the Web pages range from 102 to 921,000 bytes. The dynamic content models GIF advertisement rotation. There is no SSL content. SPECweb99 is relevant because Web serving, especially with Apache, is one of the most common uses of Linux servers. Apache is rich in functionality and is not designed for high performance. However, we chose Apache as the Web server for this benchmark because it currently hosts more Web sites than any other Web server on the Internet. SPECweb99 is the accepted standard benchmark for Web serving. SPECweb99 stresses the following kernel components: scheduler, TCP/IP, various threading models, sendfile, zero copy and network drivers.
Figure 3. SPECweb99 benchmark results using the Apache Web server
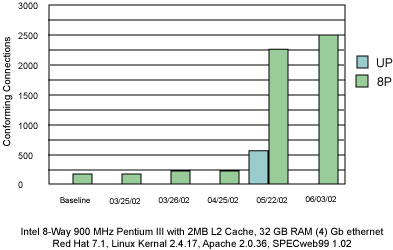
Presented in Figure 3 are our results for SPECweb99. Also included is a description of the hardware and software configurations used and our benchmark target. We have a close collaboration with the Linux kernel development team and the IBM Apache team as we make progress on the performance of this benchmark. Some of the issues we have addressed that have resulted in the improvements shown include adding O(1) and read copy update (RCU) dcache kernel patches and adding a new dynamic API mod_specweb module to Apache. As shown in Figure 3, we have exceeded our target on this benchmark; however, there are several outstanding Linux kernel component-related issues we are addressing that we believe will significantly improve the performance of this benchmark.
Linux has enjoyed great popularity, specifically with low-end and midrange systems. In fact, Linux is well regarded as a stable, highly-reliable operating system to use for Web servers for these machines. However, high-end, enterprise level systems have access to gigabytes, petabytes, and exabytes of data. These systems require a different set of applications and solutions with high memory and bandwidth requirements, in addition to larger numbers of processors (see Resources for the developerWorks article, "Open source in the biosciences", which discusses this type of application).
This type of system application introduces a unique set of issues that may be orders of magnitude more complex than those present in smaller installations. In order for Linux to be competitive for the enterprise market, its performance and scalability must improve.
Our experience thus far indicates that the performance of the Linux kernel can be improved significantly. We are proud to contribute to this goal by working within the open source community to quantify Linux kernel performance, and to develop patches to address degradation issues to make Linux better, and to make it enterprise ready.
ACKNOWLEDGMENTS:
We would like to thank Kaivalya Dixit, Dustin Fredrickson, Partha Narayanan, Troy Wilson, Peter Wong, and the LTC Linux kernel development team for their input in preparing this article.
Sandra K. Johnson is Manager, Linux performance at the IBM Linux Technology Center in Austin, Texas. She has over 14 years of experience in her broad areas of interest, including the design and performance evaluation of memory systems, cache coherence protocols, parallel I/O, parallel file systems, Java server performance, application server/database integration, and Linux performance. She is a member of the IBM Academy of Technology. Sandra can be reached at sandraja@us.ibm.com.
Bill Hartner is the technical lead for the IBM Linux Technology Center Performance Team. Bill has worked in operating systems performance for about 10 years and on Linux performance for about 4 years. Bill can be reached at bhartner@us.ibm.com.
Bill Brantley has been involved in UNIX performance since 1985 while at the IBM T. J. Watson Research Center in Yorktown Heights, NY, and then at IBM in Austin, TX. For the last 3 years he has been focused on Linux performance. Currently he is working on x86-64 Linux performance at Advanced Micro Devices. He can be reached at Bill.Brantley@amd.com.
Copyright 2003