Open Benchmark
Windows NT Server 4.0 and Linux
By Bruce Weiner
June 30,1999
Overview
Open Benchmark Vindicates Mindcraft's Reputation and Shows Windows NT Server 4.0 Significantly Outperforms Linux
Mindcraft's first Windows NT Server/Linux benchmark [http://www.mindcraft.com/whitepapers/nts4rhlinux.html] received criticism from the Linux community regarding configuration mistakes we made. To address these concerns, Mindcraft conducted a Second Benchmark of Windows NT Server 4.0 and Red Hat Linux 5.2 this time upgraded to the Linux 2.2.6 kernel. For the Second Benchmark we asked for and received tuning help from leaders of the Linux, Samba, and Apache communities. However, even before the Second Benchmark was finished we received additional criticism about the fairness of this test. We decided to withhold publication of the Second Benchmark results and instead proposed the Open Benchmark [http://www.mindcraft.com/openbenchmark.html].
The purposes for the Open Benchmark were:
The Open Benchmark measured the file- and Web- server performance of Windows NT Server 4.0 and Linux using the Ziff-Davis Benchmark Operation's NetBench 5.01 [http://www.zdnet.com/zdbop/netbench/netbench.html] file-server benchmark and WebBench 2.0 [http://www.zdnet.com/zdbop/webbench/webbench.html] Web-server benchmark. All of the tests used the same Dell PowerEdge 6300/400 server.
PC Week oversaw the Open Benchmark. It was conducted in three phases with Red Hat, Microsoft, Mindcraft, and PC Week witnessing all tests1:
As you will see in this white paper, the results from our earlier benchmarks are very close to those of the Open Benchmark.
This white paper is divided into two major parts. The first part presents the details about Phases 1 and 2. These phases are combined in one part because they cover the same versions of software. The second part presents the details of Phase 3. We've also included an FAQ with this white paper based on feedback from our earlier report. For those that are interested, we have included a page with links to all of the Linux tunes and patches used in the Open Benchmark.
Result Summary
Phases 1 and 2
Phases 1 and 2 used only a four-processor configuration of a Dell PowerEdge 6300/400 server. We used Red Hat Linux 5.2 upgraded to the Linux 2.2.6 kernel for Phases 1 and 2 ("Linux" in Phases 1 and 2) in order to match the software used in our Second Benchmark. Also, we used Windows NT Server 4.0 with Service Pack 4 installed.
File-Server Tests
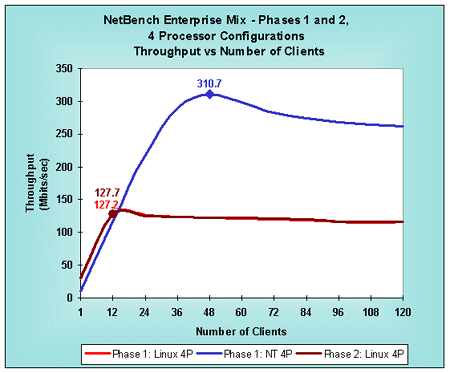
Figure 1 shows the file-server performance in Phases 1 and 2. We used Samba 2.03 as the Linux file server software. The Linux results Mindcraft obtained in Phase 1 and the results Red Hat obtained in Phase 2 are identical (the slight difference is within the normal variations found between runs of identical configurations).
The file-server tests show that Mindcraft obtained the same performance as Red Hat, demonstrating that Mindcraft's test was unbiased.
Figure 1: File Server Performance in Phases 1 and 2
(larger numbers are better)

Web-Server Tests
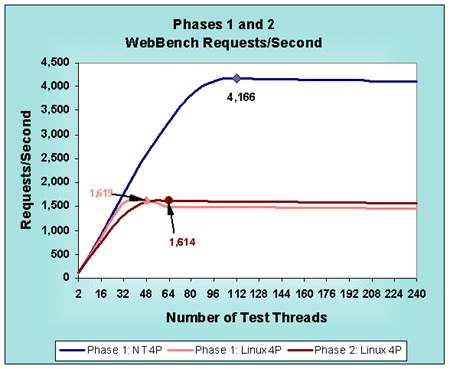
Figure 2 shows the Web-server performance in Phases 1 and 2. We used Apache 1.3.6 as the Web server on Linux. Mindcraft and Red Hat obtained identical test results, within normal run-to-run variances.
The Web-server tests show that Mindcraft obtained the same performance as Red Hat, demonstrating again that Mindcraft's test was unbiased.
Figure 2: Web Server Performance in Phases 1 and 2
(larger numbers are better)
Phase 3
Phase 3 used both a one- and four-processor configuration of the same Dell server. Mindcraft used the same version of Windows NT Server 4.0 as in Phases 1 and 2. Red Hat chose to use Red Hat Linux 6.0 upgraded to the 2.2.10 kernel ("Linux" in Phase 3). See Phase 3 of this white paper for the other software and hardware changes that Red Hat made.
File-Server Tests
Figure 3 shows the file-server performance we measured and the scaling between one- and four-processor configurations. Linux file-server performance on a four-processor system increases by 43% over a one-processor system. Windows NT Server, on the other hand, improves performance on a four-processor system by 105% over a one-processor system.
Figure 3: File Server Performance in Phase 3
(larger numbers are better)
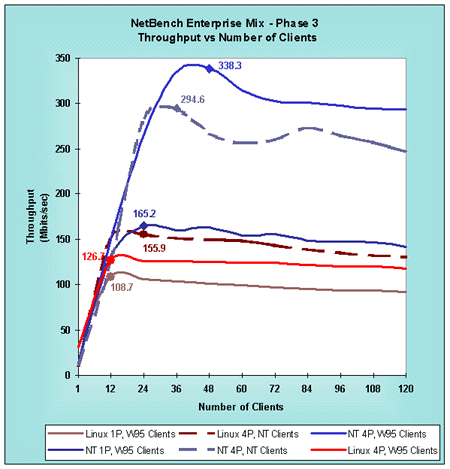
Figure 3 shows that all Windows NT Server configurations are faster file servers than any of the Linux configurations. Table 1 summarizes the Windows NT Server speed advantage over Linux.
| # of Processors | Client Type | Windows NT Is Faster Than Linux By |
| 1 | Windows 95 | 1.5 times |
| 4 | Windows NT | 1.9 times |
| 4 | Windows 95 | 2.7 times |
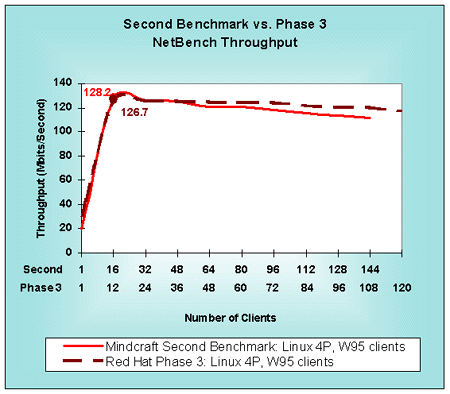
Figure 4 shows that Red Hat's Phase 3 file-server performance matched the results Mindcraft obtained in the Second Benchmark.
Thus, Mindcraft obtained the best Linux performance possible for the four-processor server configuration, demonstrating again that Mindcraft's test was unbiased.
Figure 4: File-Server Performance in the Second Benchmark and Phase 3
(larger numbers are better)
Web-Server Tests
Figure 5 shows the Web-server performance for all of the phases. It shows that Red Hat was able to achieve 14% better performance than Mindcraft did in Phase 1 by using later software and different tuning for Apache, including static file caching. See Phase 3 for the details.
The Web-server tests show that Windows NT Server is 2.2 times faster than Linux 2.2.10/Apache 1.3.6 on a four-processor server and 1.4 times faster on a one-processor server.
Figure 5: Web Server Performance in Phases 1, 2 and 3
(larger numbers are better)
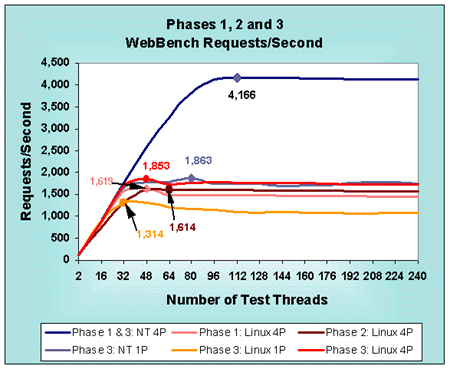
The performance scaling differences between Linux and Windows NT Server are even more pronounced for Web servers. Linux increases four-processor system performance by 42% over a single processor system. Compared to the 124% performance scaling improvement Windows NT Server demonstrates, Linux has to make significant multiprocessor system performance improvements before it can catch Windows NT Server in scalability.
Linux file- and Web-server performance appears to be bottlenecked in the operating system kernel, not in Samba or Apache. This was demonstrated best when the Red Hat engineers ran the Zeus Web server. Zeus performance topped out at about the same place as Apache, using fewer resources. The major performance problems are with the TCP stack, which is single threaded in the 2.2.x Linux kernels, and with large-grained kernel locks that degrade multiprocessor performance. The Linux community is addressing these performance problems and others in their 2.3.x kernel series.
Conclusions
Mindcraft Certification
Mindcraft certifies that the benchmark results reported in this white paper accurately represent the performance of Windows NT Server 4.0, Linux, Apache, and Samba running on a Dell PowerEdge 6300/400 server configured and tested as specified herein.
Our test results should be reproducible by others using the same test lab configuration, the same Dell server configurations, and the same software configurations documented in this report.
Footnotes
Acknowledgements
We thank John Taschek of PC Week for inviting the participants to hold the Open Benchmark at ZD Labs in Foster City, California. We also thank Pankaj Chowdhry and Henry Baltazar, both from PC Week, for overseeing the Open Benchmark.
Thanks to all of the participants in the Open Benchmark: Doug Ledford and Zach Brown from Red Hat as well as Michael Stephenson, Brad Waters, and Neel Jain from Microsoft. A special thanks to Bob Young, President of Red Hat, for participating in the Open Benchmark.
Finally, we want to thank Linus Torvalds, Alan Cox, Jeremy Allison, David Miller, Dean Gaudet, and Doug Ledford who provided tuning information and patches that we used in the Second Benchmark.
NOTICE:
The information in this publication is subject to change without notice.
MINDCRAFT, INC. SHALL NOT BE LIABLE FOR ERRORS OR OMISSIONS CONTAINED HEREIN, NOR FOR INCIDENTAL OR CONSEQUENTIAL DAMAGES RESULTING FROM THE FURNISHING, PERFORMANCE, OR USE OF THIS MATERIAL.
This publication does not constitute an endorsement of the product or products that were tested. This test is not a determination of product quality or correctness, nor does it ensure compliance with any federal, state or local requirements.
Mindcraft is a registered trademark of Mindcraft, Inc.
Product and corporate names mentioned herein are trademarks and/or registered trademarks of their respective companies.
Copyright © 1999 Mindcraft, Inc.